Data management can be tough, especially for those who are less numbers-oriented. I’ve been working with data for 15 years, gathering environmental data in the field, analyzing, modeling, and disseminating data at the United Nations, and now, working on the entire data chain for ACDI/VOCA—from database architecture design to final product.
In that time, I’ve made about every error you can think of and spent considerable time training others and discussing data quality. I’ve been noting mistakes along the way and extrapolated these into general tips for working with data. These tips work for me, but please feel invited to disagree and post your own findings in the comment section below!
We’ll start with three unbreakable and universal rules to data management:
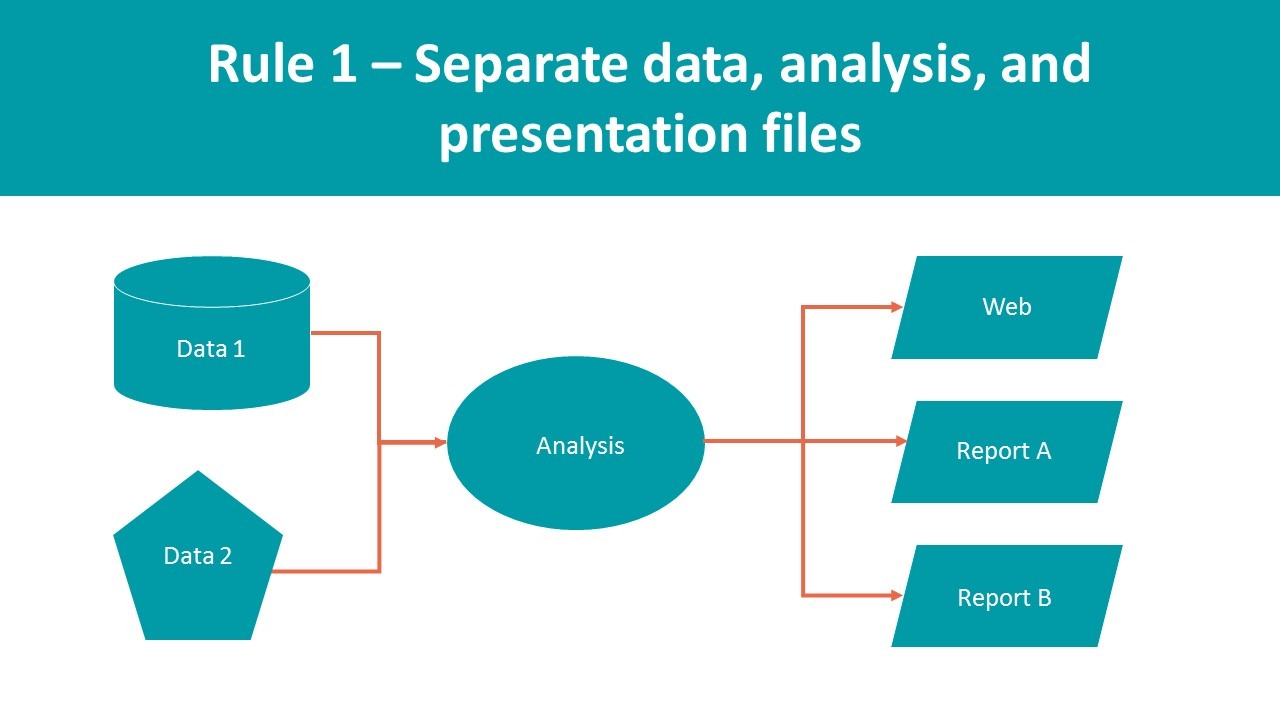
1. Separate data storage, analysis, and presentation.Frequently, your workflow involves doing everything you have to do within one Microsoft Excel file, which is fine if you’re working on one-off projects. But if you plan to work with the same data set again, that workflow maximizes the amount of work. Think of it this way: What are you going to do with the data set next month? Redo the whole thing? What happens when you find out one of the backup numbers is wrong? What if you have the file translated to five different languages and then realize you messed up the analysis? These are just some of the horror stories avoided by having a proper reproducible workflow, something I’ll reference often in this series.But don’t be scared off; you can start small! A reproducible workflow allows you to have one file with all the data fed to you, one file where you work your magic, and another for presentation. Use the same approach to get from one file to the next. In fact, write it down, so that you remember. (It also helps to learn to work with Visual Basic for Applications macros in Microsoft Excel, or a scripting language, like R.)This way, you only need to worry about the logo, date, formatting, charts, maps, and suppressing and translating information at the end of your workflow.
 2. Store data in its most disaggregated form.You can always aggregate raw data, but you can’t split up an aggregate. Say you list everyone who attended every birthday party you’ve ever had. You can summarize that data into the number of people by age group who attended each party. But if you only stored the age group data, you would never be able to calculate, for example, the number of men or women who attended each party. Here’s where storing raw data shines. It covers you for when you want to do new analyses, which is essential to learning. There are some caveats:-Capture all aggregation variables. For example, you should capture not just a list of people, but also their age or, better yet, their date of birth because it will not change.-You can go crazy trying to gather as much disaggregated information as possible. But data costs money, so try your best to decide on a reasonable amount that you may want to analyze in the future.-Some people will tell you that storing raw data makes no sense because it takes up too much space and is just plain hard to work with. Don’t listen to those people. You’ll see why in subsequent blog posts.-When aggregating raw data, we run into a lot of questions about statistical significance. If I have the populations of three cities in a country, can I add those up and pretend they are the country’s population? Of course not. Just because you can aggregate, doesn’t mean you aren’t responsible for ensuring statistical significance.
3. Save one thing in one place.This applies to files and data within a data set…and, in fact, everything! If something exists in multiple files or tables, like the gender of individuals, you will confuse the person doing your data entry. Your analysis will take longer and often be incorrect anyway. If information exists in one master location, you can copy or hyperlink it to wherever else you need. Then make sure you edit the master location and design a workflow to propagate the changes everywhere else. You’ll notice that this rule feeds into the first rule about obeying the workflow and ensuring you don’t short circuit for convenience.
Please share your thoughts on these tips, or others, in the comments below.
If you liked this post, you won’t want to miss the next blog in the series, Part 2: Data 101–Quality.
View all blogs in the Data Digest series
Comments