
If you missed the first post in the Data Digest series, I recommend you start here, with the beginning of my list of unbreakable and universal rules for data management. These first three rules include the following:
1. Separate data storage, analysis, and presentation.
2. Store data in its most disaggregated form.
3. Save one thing in one place.
Read on for a continuation of this list, as I dive into tips for ensuring data quality. And again, this is only my school of thought, so please share if you agree or disagree in the comments below.
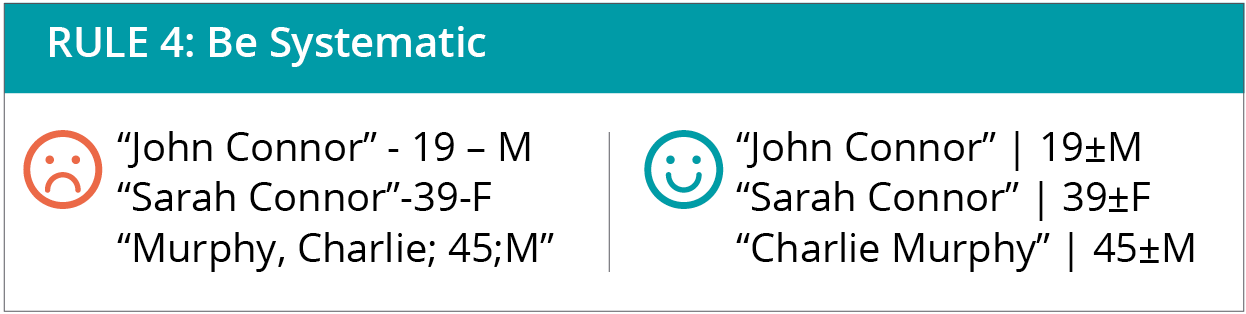
4. Be systematic.
In other words, use consistent formatting in your workflow, and try to add semantic meaning to everything, even if you don’t have to. This is called structuring data, and you’ll see the benefits almost immediately. Here’s how:
-Be consistent with underscores, dashes, commas, and periods. Think about the references section of a scientific publication. Why do you think publishers are so annoyingly specific about the notation? When you’re consistent in the way you use symbols, it allows for subsequent analysis, which opens up a world of meta-analysis and quality control.
-Pay attention to spaces. For example, “Monica ” is different from “Monica ” or ” Monica.” These examples illustrate leading and trailing spaces, or spaces that come before or after the characters. Both are particularly annoying variants. You would be surprised how often spaces cause errors, especially double instead of single spacing in unique identifiers, like passport numbers. In Microsoft Excel, you can keep leading and trailing spaces at bay using the command `trim()`.
-Organize your data within columns and rows the same way in all files. For example, if you do the same analysis on different country or population data, keep the column and row orders the same in each of those files. Then, if you have specific files that break that format, learn, adapt, and create a new format consistent for all files.
-Use unique characters, like “|” and “ƒ,” as long as they don’t give you errors. The more unique ways you have of separating text, the easier your life will be.
-In Microsoft Excel, respect the “data rectangle,” meaning do not put random notes or columns in the middle of a data set. This also means that for analysis files, column headers should be one row, not two or three rows for tiered headers. A good rule of thumb is to not let the merge cells function tempt you.
-Respect the number, too! When storing numbers, do not mix the number and unit in the same column. Number columns are numeric; respect them! You can have a separate column for units.
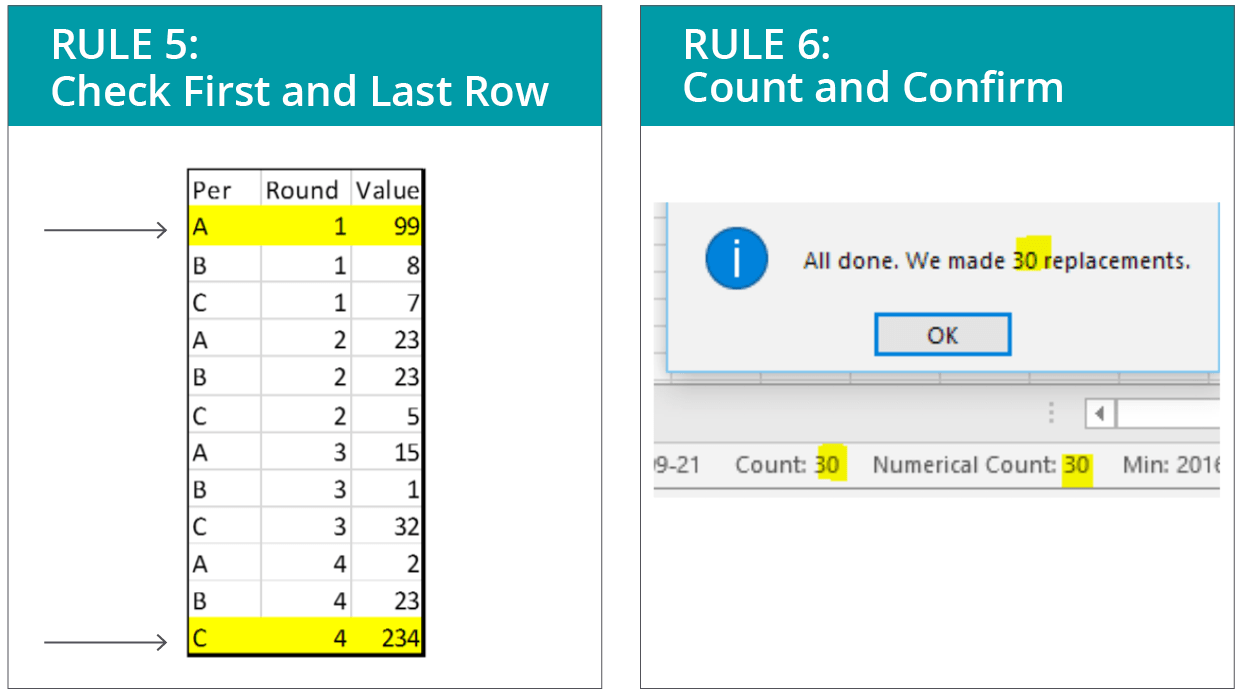
 5. Check the first and last rows.This one is a jewel in terms of its simplicity and payoff. Within the realm of data quality control, it can sometimes be hard to know how far to go. I think the amount of quality control should be directly proportional to a system’s tolerance for error. Some people say that spot-checking 10 percent of data is a minimum, but as data sets grow larger, even that quickly becomes a daunting task.I have found that most errors will have repercussions on either the first or last row of data, so look there for at least minimal assurance that you completed your operation successfully. This will catch many copy and pasting mistakes, truncated data problems, unexpectedly missing data, and assorted “uh-ohs” in your lists, spreadsheets, and data frames.
6. Count and ConfirmThis one is also easy and surprisingly effective, yet remarkably few people do it. When doing an action, hypothesize what you expect to happen.For example, when you search and replace “Andrew Jackson” with “Andrew P. Jackson,” and it says you performed 577 replacements, but you know 580 records exist, then you know something went wrong. Look for mistakes in the data, like “Andrew Jackson” with double spacing. (I told you that would happen!) It can be tricky to get the hang of thinking this way, but it helps with spotting human error.
View all blogs in the Data Digest series
Comments