Imagine your project has a massive participant target that is six digits long, and your client wants each routine report to give a precise count of how many individuals are first-time participants (i.e., “New”) versus how many are returning participants (i.e., “Continuing”) in each reporting period.
There is a convenient solution, if you are using the date reference table outlined in this series. In addition to automating the allocation of project results within the correct reporting period (as in part one) and calculating exact participants without duplication (as in part two), the same mechanism will allow you to automate “New” and “Continuing” project participant counts.
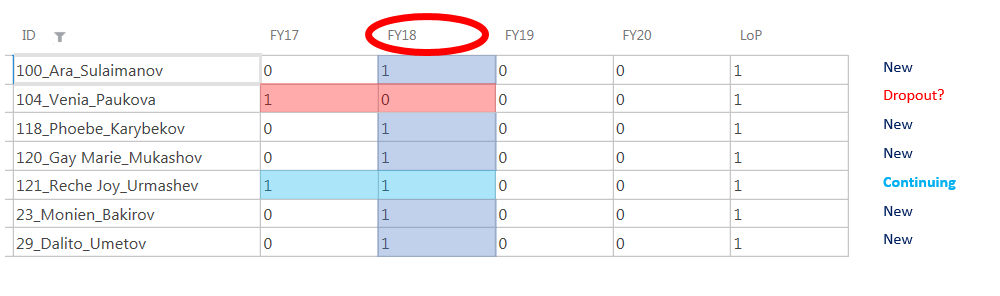
Let’s look back at the first query produced in part two of this series, when we created a table with a list of all participant identifications, followed by binary fields to indicate participation for each reporting period and the life-of-project (i.e., “1,” if they participated at least once, and “0,” if they have not participated). Looking at fiscal year 2018 (FY18), we can compare these binary values with those from the previous period of fiscal year 2017 (FY17) to determine exactly which participants are “New” or “Continuing” participants.
Calculating “Continuing” Participants
For the first project year, which in this case was FY17, every participant is “New,” so there is no need for any complex test; you can set this year’s value to zero “Continuing” participants.
For the second project year, we can use a logical test. The most straightforward logical test to compare the binary values for each year is to test if FY17 and FY18 are both equal to “1” for each. If the individual’s participation data indicates a “1” for both years, then they are “Continuing” participants.
For the third, fourth, and subsequent project years, it is necessary to continue expanding the syntax to always test the current project year as well as every previous project year. This will help determine if an individual is “Continuing” for fiscal year 2019 (FY19). If so, their participation for FY19 must equal “1,” and their participant for FY17 or FY18 — or both — must equal “1.”
In Microsoft Access, the query setup would look like this:
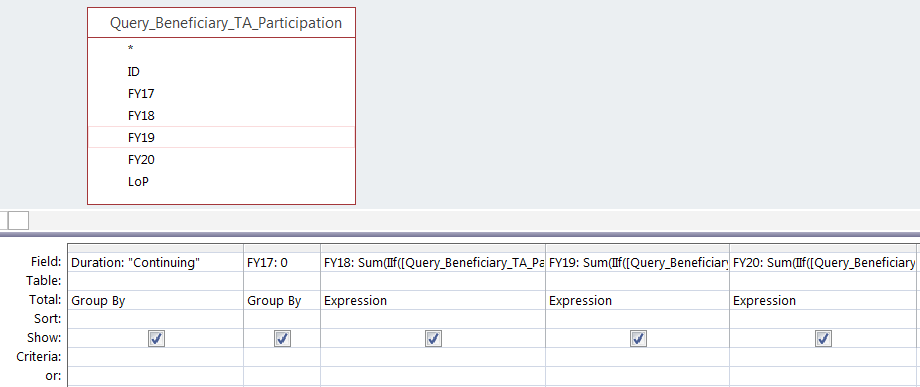
- Duration: “Continuing”
- FY17: 0
- FY18: Sum(IIf([Query_Beneficiary_TA_Participation].[FY18]=1 And [Query_Beneficiary_TA_Participation].[FY17]=1,1,0))
- FY19: Sum(IIf([Query_Beneficiary_TA_Participation].[FY19]=1 And ([Query_Beneficiary_TA_Participation].[FY18]=1 Or [Query_Beneficiary_TA_Participation].[FY17]=1),1,0))
- FY20: Sum(IIf([Query_Beneficiary_TA_Participation].[FY20]=1 And ([Query_Beneficiary_TA_Participation].[FY19]=1 Or [Query_Beneficiary_TA_Participation].[FY18]=1 Or [Query_Beneficiary_TA_Participation].[FY17]=1),1,0))
In SQL, the command would be as follows:
SELECT “Continuing” AS Duration, 0 AS FY17, SUM(CASE WHEN FY18=1 AND FY17=1 THEN 1 ELSE 0 END) AS FY18, SUM(CASE WHEN FY19=1 AND (FY18=1 OR FY17=1) THEN 1 ELSE 0 END) AS FY18, SUM(CASE WHEN FY20=1 AND (FY19=1 OR FY18=1 OR FY17=1) THEN 1 ELSE 0 END) AS FY20 FROM Query_Beneficiary_TA_Participation;
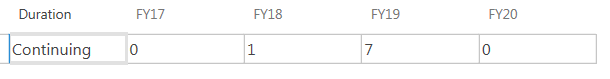
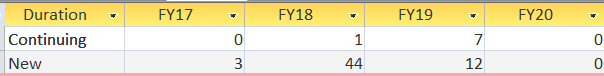
The result will look like this:
Calculating “New” Participants
Because FY17 is the first year of this example, we know that all participants participating in FY17 are “New.” That means we can do a sum of the FY17 field to count all participants as “New.” For the following reporting periods, we need our logical test to check for participation in a given fiscal year (equal to “1”) and for no participation in any of the prior project years. (All previous fiscal year fields must be “0.”)
In Microsoft Access, the query setup would look like this:
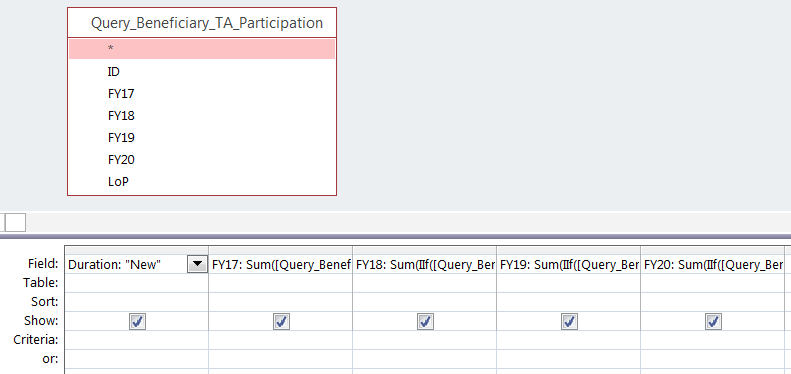
- Duration: “New”
- FY17: Sum([Query_Beneficiary_TA_Participation].[FY17])
- FY18: Sum(IIf([Query_Beneficiary_TA_Participation].[FY18]=1 And [Query_Beneficiary_TA_Participation].[FY17]=0,1,0))
- FY19: Sum(IIf([Query_Beneficiary_TA_Participation].[FY19]=1 And [Query_Beneficiary_TA_Participation].[FY18]=0 And [Query_Beneficiary_TA_Participation].[FY17]=0,1,0))
- FY20: Sum(IIf([Query_Beneficiary_TA_Participation].[FY20]=1 And [Query_Beneficiary_TA_Participation].[FY19]=0 And [Query_Beneficiary_TA_Participation].[FY18]=0 And [Query_Beneficiary_TA_Participation].[FY17]=0,1,0))
In SQL, the command would be as follows:
SELECT ‘New’ AS Duration, SUM(FY17) AS FY17, SUM(CASE WHEN FY18=1 AND FY17=0 THEN 1 ELSE 0 END) AS FY18, SUM(CASE WHEN FY19=1 AND FY18=0 AND FY17=0 THEN 1 ELSE 0 END) AS FY19, SUM(CASE WHEN FY20=1 AND FY19=0 AND FY18=0 AND FY17=0 THEN 1 ELSE 0 END) AS FY20 FROM Query_Beneficiary_TA_Participation;
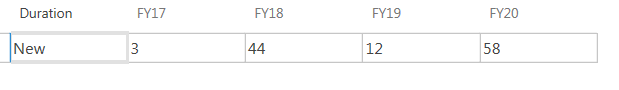
The result will look like this:
Putting “New” and “Continuing” Calculations Together
To append these two sets of calculations, simply put the two SQL commands together with a UNION command in between as follows:
SELECT ‘Continuing’ AS Duration, 0 AS FY17, SUM(CASE WHEN FY18=1 AND FY17=1 THEN 1 ELSE 0 END) AS FY18, SUM(CASE WHEN FY19=1 AND (FY18=1 OR FY17=1) THEN 1 ELSE 0 END) AS FY19, SUM(CASE WHEN FY20=1 AND (FY19=1 OR FY18=1 OR FY17=1) THEN 1 ELSE 0 END) AS FY20 FROM Query_Beneficiary_TA_Participation UNION SELECT ‘New’ AS Duration, SUM(FY17) AS FY17, SUM(CASE WHEN FY18=1 AND FY17=0 THEN 1 ELSE 0 END) AS FY18, SUM(CASE WHEN FY19=1 AND FY18=0 AND FY17=0 THEN 1 ELSE 0 END) AS FY19, SUM(CASE WHEN FY20=1 AND FY19=0 AND FY18=0 AND FY17=0 THEN 1 ELSE 0 END) AS FY20 FROM Query_Beneficiary_TA_Participation;
Stay tuned for part four of this series, in which we will outline how to automate precise calculations of direct beneficiaries from participation across multiple possible activities!
View all blogs in the Data Digest series
Comments