
As data experts, we love precision in our project performance reporting. One of the data management nightmares that many implementers face is double counting, particularly if a donor questions a report (i.e., “Those numbers seem high; are you sure you aren’t counting the same people more than once?”).
Luckily, the date reference approach covered in part one of this blog series enables us to get an exact and fully traceable count of individual participation in activities for any reporting period or date range.
Let’s say that our project provides frequent technical assistance to many participants, and our monitoring and evaluation indicator requires an exact count of those participants. However, based on our project design, an individual may receive assistance many times throughout the year. If we simply count the number of signatures on a sign-in sheet, we will have a lot of double counting!
Fortunately, with a simple modification to our database’s date reference table, which we designed in part one, we can easily reconcile this. In the table, you will need to add a column for each reporting period. For this example, I will use the fiscal year (FY):
- FY17 (October 1, 2016 – September 30, 2017)
- FY18 (October 1, 2017 – September 30, 2018)
- FY19 (October 1, 2018 – September 30, 2019)
- FY20 (October 1, 2019 – September 30, 2020)
- And one column for the life of project (LOP) to capture the full project range (October 1, 2016 – September 30, 2020)
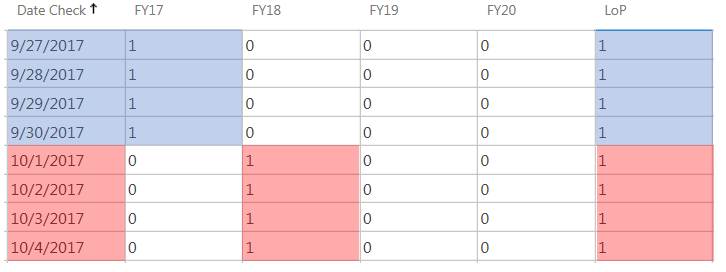
Each column above must be a numeric data type. Next, for each date within the project range, assign a one or zero value to each appropriate FY and the LOP. You can also automate this as a calculation in Microsoft Access and SQL, respectively, with a logical test, such as:
- FY17: IIf([Date Check]>=#10/1/2016# And [Date Check]<=#9/30/2017#,1,0); or
- CASE WHEN [Date Check]>=’2016-10-01′ AND [Date Check]<=’2017-09-30′ THEN 1 ELSE 0 END AS FY17.
The resulting table will look like this:
Now we can use these date reference binary values for each reporting period to calculate participants numbers for each reporting period without a risk of double counting. For this example, we will use our participant registry, where each individual’s profile and unique identification is stored, and our technical assistance tracker, which tells us exactly what kind of assistance each individual received and when. This will require two queries:
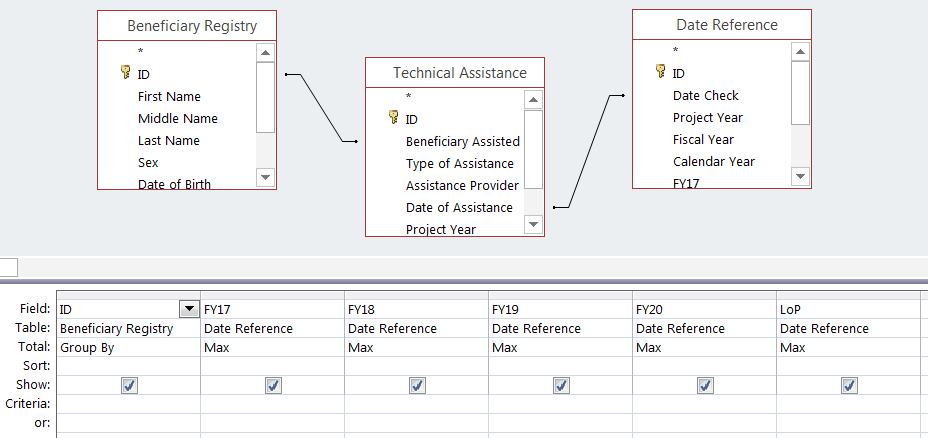
Query 1
Because our participant registry lists each individual one time, we can group our calculations by identification (noted as ID on the table) to check which reporting period each individual participated in. By joining the date in our technical assistance tracker to the date reference table, every assistance transaction will automatically link to the appropriate FY reporting period.
(Note: In this case, our database has a built-in relationship between the participant registry, or parent table, and technical assistance tracker, or child table. It is not necessary to build a relationship (i.e., lookup field type) between the date reference table and any others, as long as date field types appear in all tables that need to reference the date reference table.)
Because the FY and LOP columns have a binary (zero or one) value, we can take the maximum (noted as MAX on the table) of each reporting period. The result is a list of participants who participated in technical assistance, followed by a zero or one value for each reporting period. One means they participated at least once during that reporting period; zero means they did not participate at all. By using MAX, even if a participant received many services during the reporting period, it will only return one (i.e., distinct count).
In Microsoft Access, the query setup looks like this:
If you prefer SQL, you can use the following command:
SELECT [Beneficiary Registry].ID, MAX([Date Reference].FY17) AS FY17, MAX([Date Reference].FY18) AS FY18, MAX([Date Reference].FY19) AS FY19, MAX([Date Reference].FY20) AS FY20, MAX([Date Reference].LoP) AS LoP FROM [Technical Assistance] GROUP BY [Beneficiary Registry].ID;
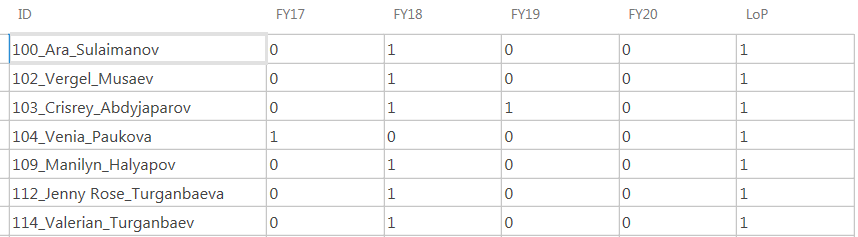
The resulting table will look like this:
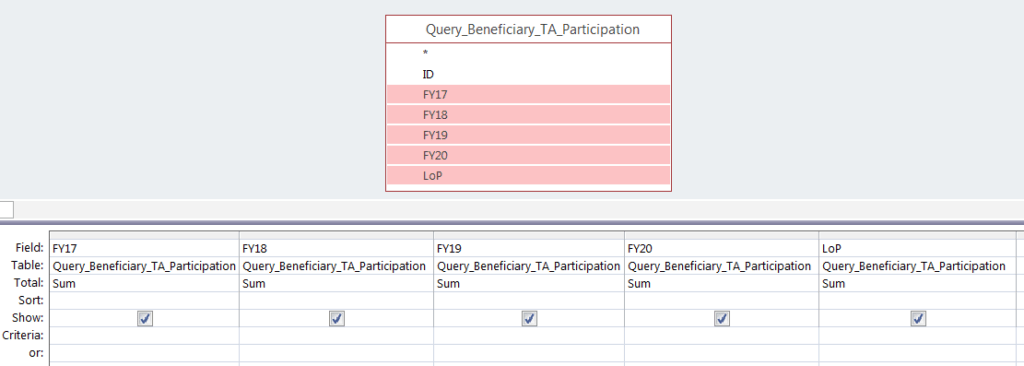
Query 2
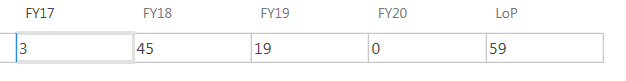
Now you can simply use this first query to create a second query to calculate the sum of each FY and LOP column. This will give you an exact count of participants who received assistance in each reporting period!
In Microsoft Access, you can make a second query with the first query as your source:
Or, in SQL, you can embed the first query within the second query, like this:
SELECT SUM(FY17) AS FY17, SUM(FY18) AS FY18, SUM(FY19) AS FY19, SUM(FY20) AS FY20, SUM(LoP) AS LoP FROM
(SELECT [Beneficiary Registry].ID, MAX([Date Reference].FY17) AS FY17, MAX([Date Reference].FY18) AS FY18, MAX([Date Reference].FY19) AS FY19, MAX([Date Reference].FY20) AS FY20, MAX([Date Reference].LoP) AS LoP FROM [Technical Assistance] GROUP BY [Beneficiary Registry].ID)
AS Query_Beneficiary_TA_Participation;
The result will be the table with your final distinct count calculations for each project reporting period:
Why use the date reference table method?
It is certainly possible to achieve the same result without a date reference table. However, the alternative is manually building in the distinct count calculations with all date ranges into every one of your database tables that has indicator data. Here are the main advantages to using a date reference table:
- It is less work to only program the date ranges into your database once in this central location, which also reduces the risk of syntax errors;
- It is more efficient for projects that need exact calculations for participation across multiple, defined reporting periods (e.g., new and continuing participants).
- It allows you to easily incorporate multiple data tables into this calculation. This is useful for projects that have many activities tracked in different tables, such as training, financial services, input distribution, but that need to produce a distinct count of participants who factors in all the activities.
- It also allows you to easily create binaries for calendar years or quarters and modify the queries to answer to any reporting requests that come up.
View all blogs in the Data Digest series
Comments