If you missed the first and second posts in the Data Digest series, I recommend you start there. In these posts, I dive into my list of unbreakable and universal rules for data management and quality:
- Separate data storage, analysis, and presentation.
- Store data in its most disaggregated form.
- Save one thing in one place.
- Be systematic.
- Check the first and last rows.
- Count and confirm.
Read on for the conclusion of this list. As always, this is only my school of thought, so please feel free to agree or disagree in the comments below.
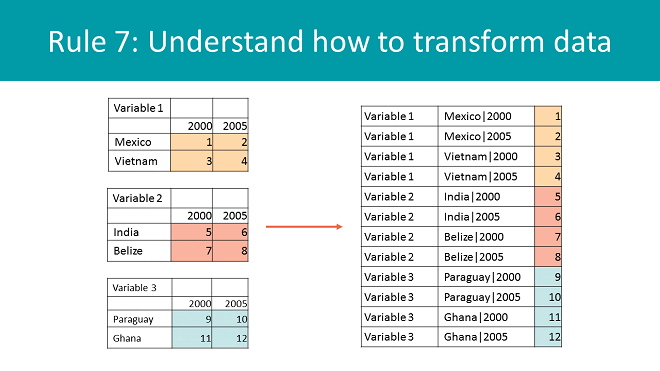
7. Understand how to transform data.
You need to get comfortable with two data formats: tables and lists. A table has rows and columns and is the main format used in Microsoft Excel spreadsheets.
- When working with data, keep your row and column headers to one cell each. This way, every column header is in one row, every row heading is in one column, and the data rectangle is present. I cannot overstate the importance of respecting the data rectangle.
- There should be no blank cells in row and column headers. It should be clear where your data set begins and ends, and each data point should be identifiable by the row and column headers.
- Concatenate, or combine, columns to reduce data set dimensions. For example, if your data set has “Country” and “Year”, plus three variables, then you would need to visualize those three dimensions. Because a table can only show two dimensions (rows and columns), concatenate “Country” and “Year” into a new dimension called “Country | Year” and use variables as the second dimension. Then you can still have the data rectangle, even in multidimensional schemas.
One of my idols, Hadley Wickam, wrote a whole thing about the merits of the list, or tidy format. To paraphrase a lot—please don’t kill me, R users—it means that data lives in only one column, and the other columns just describe the data point. So, a 10-cell by 10-cell table would have 100 observations, right? As a list, it would be 100 rows long. This format helps with loading files into databases, statistical programs, filtering, analyzing, and storing, but it also works as an intermediary for going from one format to another.
Get comfortable with switching between lists and tables. In R, you can use tidyr to change the shape of the data set. In Excel, you can go from a list to a table using pivot tables, but going from a table to a list is not trivial. You can use this handy dandy tool developed by yours truly for small data sets if you need to transform data shapes in Excel.
8. Have a good backup and version control system.
First, remember to back up. You should save files to your server or cloud storage, or to two removable hard drives kept geographically separated, i.e., one at work and one at home to protect against fires, theft, and earthquakes. Now, let’s talk version control.
People often aren’t good at naming files because they try to combine content with context in a file name. However, it is never enough information and the conditions change. That final file is not so final after your boss pulls out the red pen, and information like who made edits or when those edits happened don’t tell you much about what is in the file.
This is one of the worst ways to name files:
- important file.xls (Oh, no. How do I go back to last week’s version?)
This is a bad way to name files:
- important file.final.xls
- important file.final.version.2.xls
- important file.final.version.2.Initials.xls
- important file.final.version.2.Initials.1.2.2016.draft.xls
This is a decent way to name files:
- important file.v1.xls
- important file.v1.1.xls
- important file.v1.2.xls
- important file.v2.0.released.xls
This is an excellent way to name files:
- important file.xls
That’s it! I use Git, an open source version control system, which keeps all versions for me. Software like Git has one purpose: version control. Git works on a commit basis, meaning instead of changing the file name to “version 3,” you commit the file exactly as it is, and the change is stored with a note specifying what changes have been made, your name, and the time. You can even assign tags, like “submitted.”
This way, when the vice president says, “No, I liked it better when you disaggregated by location,” you won’t want to rage-quit your job. You’ll say, “Sure, boss!” and fix it in one minute, get that promotion, and finally give your mother something to brag about when she plays canasta with her friends.
9. Automate tasks through scripts.
Here’s the problem: Humans are not good at quality control. There, I said it. Human error is unavoidable, and even a low error rate of 1 percent would mean 10 errors in a small data set of 1,000 rows. To truly minimize your errors, you should take yourself out of the loop as much as possible. To do that, you must learn to write scripts. You will still make mistakes, but they will be obvious because things will typically be broken magnificently. Learning to script is not that hard. I recommend the following path:
- Learn to record macros in Excel. Do this by clicking “Record Macro,” doing some stuff, and clicking stop. This will create a macro, showing code that reproduces whatever you did.
- Then proceed to download macros for Excel from the internet to do more complex actions.
- Learn to use Regular Expressions. (Seriously, they will change your life.)
- Create your own macros, then look at tools like OpenRefine.org.
- Learn to generalize your macros, so that they are flexible and work in a variety of situations. This phase is surprisingly difficult, but where true learning happens.
- Or just learn R from the beginning and skip the whole ordeal! It’s awesome and has a wonderful community.
10. Add contextual metadata to data.
One of my biggest professional epiphanies was when I understood that the number depends on the definition. (I know—deep, right?) Try this simple experiment: Ask a friend how widely they have travelled. One friend may only count the cities where they’ve lived, while another may count every city they’ve ever visited. Definitions matter. That’s why data definition tables are so important, despite boring everyone to tears.
But what about the grey area not addressed by a definition? That’s where contextual metadata comes in. For example, my response to the question may be “7 cities (in which I have lived).” This clarifies through contextual data what otherwise would have been absent.
Thinking about structured contextual metadata dissemination as a serious design criterion leads to a night-to-day difference in data quality, transparency, and efficiency.
View all blogs in the Data Digest series
Comments